
Video guide
Prefer to watch? This short guide reads the Top earning clips & shows table on your earnings dashboard — the six columns, how to read “top” by payout versus count versus recency, the date-range filter, and what the data does and doesn’t tell you.
There are two views that tell you which of your clips are pulling their weight: the Top earning clips & shows table on your earnings dashboard, and the per-clip Earnings for this product (last 90 days) card that sits on each individual clip’s edit page. Together they answer “which clips made me the most money” and “what’s a single clip actually doing for me”, and they pair well — you scan the table for headline winners, then click into a clip to confirm the trend before doubling down on a related theme.
1. The headline view — Top earning clips & shows
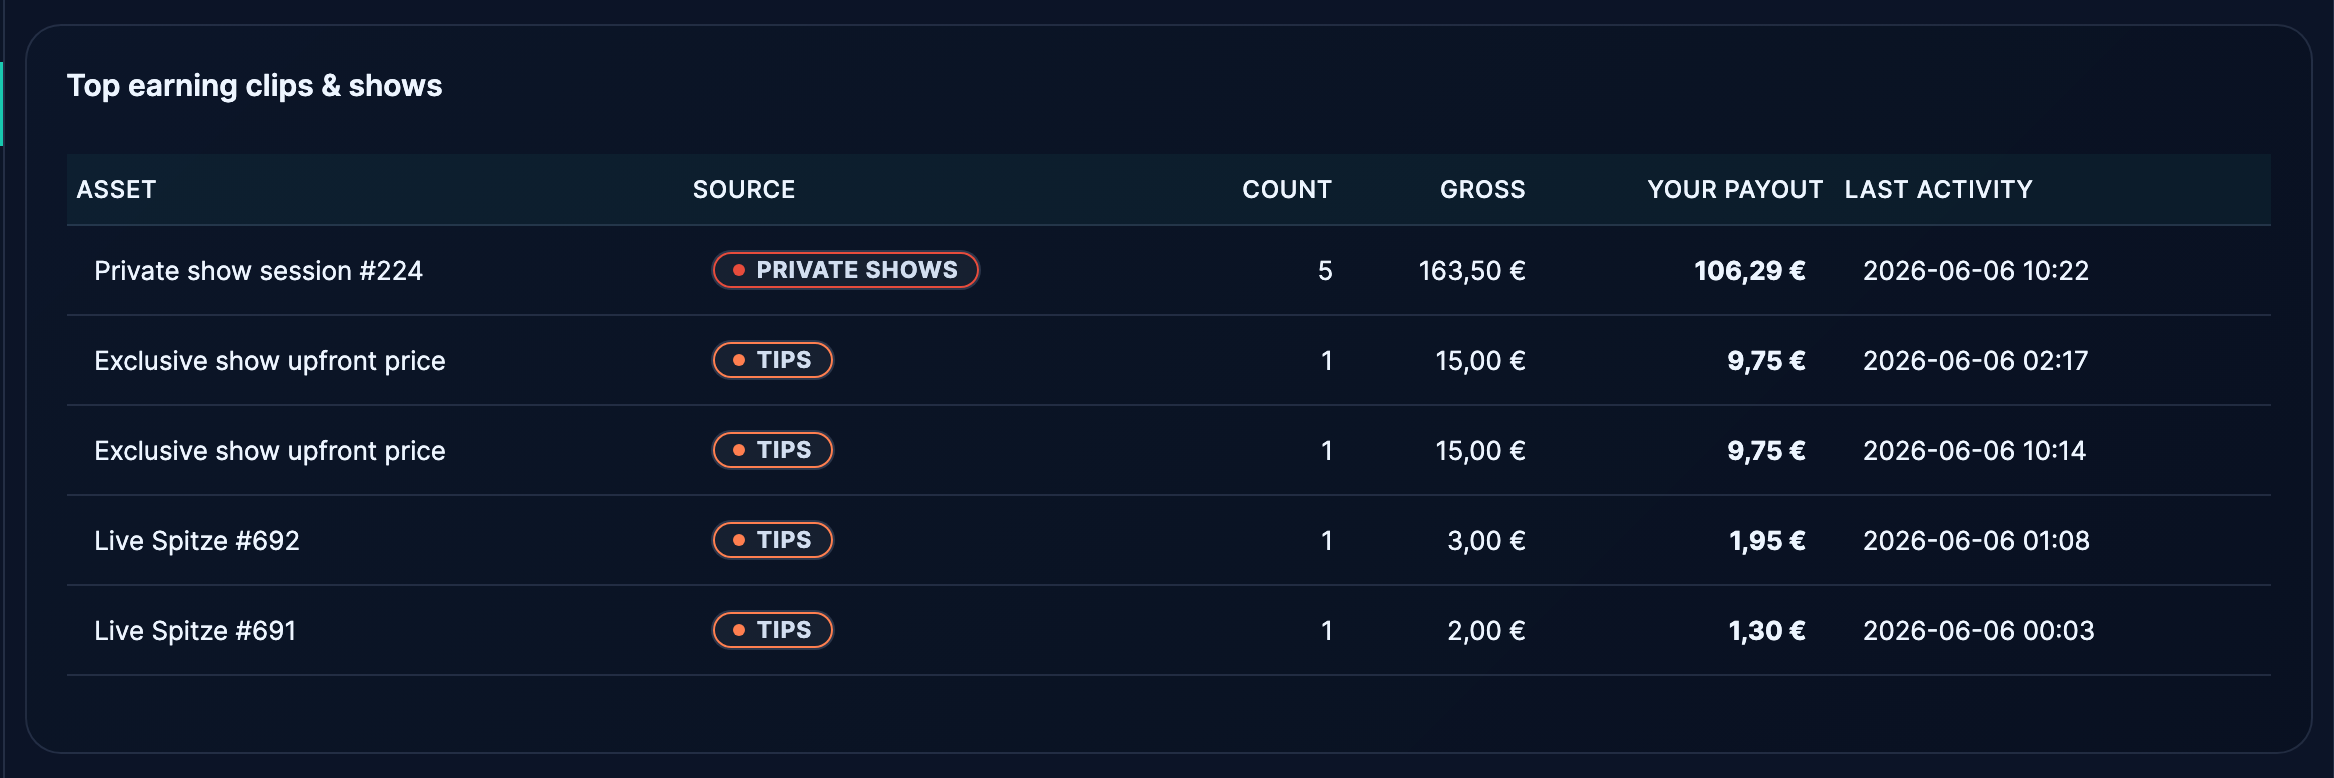
Open your earnings dashboard at /store-manager/reports-sales-by-product/. The page is titled Earnings by Source. Scroll past the KPI cards and the daily-breakdown chart and you’ll find a section called Top earning clips & shows.
The table has six columns:
- Asset — the clip title (or the show name, if it was a live ticket / private / voyeur session).
- Source — a coloured pill showing how the money was made: clip sale, PPV unlock, tip, ticket, private show, voyeur, meter, subscription, etc.
- Count — how many separate paid actions hit this asset in the window. For a clip, that’s how many people bought it. For a show, that’s how many tickets / unlocks the show generated.
- Gross — the total before commission.
- Your payout — what you actually keep after the platform’s commission split. This is the number that lines up with what hits your IBAN.
- Last activity — the timestamp of the most recent paid action on this asset.
Empty state — if the window has no qualifying revenue — reads “Nothing to list yet — once viewers tip, subscribe, or join a show, it’ll show up here.”
The date range at the top of the page is the filter for this whole table. Switch the pill to This Month, Last Month, Year, or Custom and the rankings recompute. The default is the last 7 days, which is what you want for “what’s hot right now”; jump to Year if you’re looking for evergreen winners.
The table is sorted by your payout, descending. The top row is your single best earner in the selected window.
2. The deep-dive view — per-clip earnings card
Every individual clip has its own earnings card on its edit page. To get there:
- Sign in and open /store-manager/products/ (your products list).
- Click the clip you want to inspect.
- Scroll partway down the edit page. The card sits near the top of the listing details, titled Earnings for this product (last 90 days).
The card has four small panels:
- Sales — how many copies of the clip sold in the last 90 days.
- Total — gross revenue for the clip across those 90 days.
- Your payout — what you keep after the commission split.
- Distinct buyers — how many unique fans bought the clip (a fan who bought it twice still counts as one).
If the clip has no sales yet, the card area reads “No sales yet — once someone buys this, the totals will show up here.”
The 90-day window is fixed on this card — there’s no date-range picker on the per-clip view. For longer or shorter windows, use the dashboard in §1.
3. How to read “top performing”
“Top” can mean different things depending on what you’re trying to learn:
- Top by payout — the default sort. Useful for “what makes me the most money”. This is what the dashboard table shows.
- Top by count — useful for “what gets the most buyers”. A €4.99 clip bought 200 times shows €1,000 gross but tells you the appetite is broad. A €49.99 clip bought 20 times shows €1,000 gross but tells you the appetite is narrow-and-deep. Same dashboard table — scan the Count column to compare.
- Top by recency — the Last activity column. If a clip is in the top of the table but its last activity is from 60 days ago, it’s a back-catalogue earner, not a current hit. A clip with last-activity today is in active circulation.
- Top by gross vs net — Gross and Your payout differ by the commission split. The ratio is the same across all your clips (currently 50% to you, 50% to the platform), so the order doesn’t change between sorts — but use Your payout when comparing against your own targets.
The most useful single metric for most creators is Your payout, which directly answers “what landed in my account from this clip”. The other columns are diagnostics — they tell you why the payout looked the way it did.
4. What the data won’t tell you
To set expectations honestly, the per-clip and per-asset views don’t include:
- View counts. Neither view shows how many people watched the trailer or opened the clip’s listing. We don’t expose listing-view counts because they’re noisy (auto-loads from search rails, accidental clicks, bots) and creators who optimise on that number tend to make worse decisions.
- Conversion rate. No “X% of viewers bought it” number is available, for the same reason.
- Buyer demographics. Per-clip we don’t surface country, age, gender, or any other slice. The fan-to-creator privacy model is per-pair — you see who bought and when, not who they are demographically.
- Engagement after purchase. Whether buyers watched the clip to the end, scrubbed forward, or never opened it isn’t tracked here.
- Refunded sales. Refunded transactions are excluded from both views. The footer of the dashboard prints this explicitly: “Refunded transactions are excluded.”
- Subscriptions broken down by clip. Subscription revenue lands as one row per subscriber per renewal, not split across the clips that were included in the subscription. If you want to know which subscriber-included clips drove the most subscription value, that’s a different lens — we don’t currently surface it.
5. Practical workflow — find a winner, repeat it
A simple weekly read:
- On Monday, open /store-manager/reports-sales-by-product/ and switch the date pill to Last 7 Days.
- Look at the top 3–5 rows of the Top earning clips & shows table. Note which clips are doing best and why (a high Count = broad appeal, a high Gross at low Count = a premium item).
- Click into the top clip — confirm the trend on its per-clip earnings card. If the 7-day surge also shows on a steady 90-day backdrop, that clip is a sustained winner, not a one-week blip.
- Note the clip’s tags, category, performers, length, and title style — those are the ingredients of the win. The clip itself is one data point; the pattern is what’s actionable.
- Schedule your next clip to lean toward the same ingredients. Not a duplicate (fans notice and lose interest); a variation.
And a monthly read:
- Same page. Switch the pill to Last Month.
- Compare the top of the table against the previous month — anything new in the top 5? Anything dropping out? That’s your trend signal.
- Note clips that show up every month — those are your evergreen earners. Worth keeping at full price; don’t discount them just to bump the chart.
6. The other tabs nearby (so you don’t get lost)
The Reports sidebar item lands on the legacy Sales by date tab by default. The earnings dashboard described in §1 is one tab over — Sales by product. The remaining tabs (Low in stock, Out of stock) are the legacy WooCommerce reports and won’t show clip earnings in the breakdown you want. If you’re on those tabs and confused why the numbers look thin, switch to Sales by product.
For the full guide to every part of the dashboard — KPI cards, source chips, the daily chart, the CSV download, the monthly statement — see Reading your sales dashboard — earnings by source. This article focuses on the top-table specifically; that one walks the whole page.
7. Common questions
“Why doesn’t my newest clip show up in the table even though I sold a few copies?” The table is sorted by payout, descending. If your newest clip’s payout is below the cutoff for the visible rows, it’s there in the data but below the fold. Either narrow the date range to a window where the new clip dominates, or scroll the table.
“The dashboard says Updated <timestamp> in the footer — is the data live?” Numbers refresh once per day from a daily rollup. So sales from a few minutes ago may not be in the table yet. Same-day sales appear on the next refresh, usually overnight.
“My top clip has been at the top for three months. Should I delete it after it’s run its course?” No — back-catalogue earners are pure upside. Keep them up; they cost nothing to leave there and they keep paying. Use the data to inform your next clip, not to retire the current winner.
“How do I see top performers across multiple of my performers, by performer?” Not surfaced on this page. You can filter the products list by performer on the products list page and eyeball it, but there isn’t a per-performer top-earner ranking today. Reach out via Contacting support with category Feature request if this is a gap you’d use.
“Can I export this table?” Yes — the Download CSV link in the footer of the dashboard exports the underlying data for the selected range. The CSV includes the per-asset breakdown plus the totals.
“What about my live shows — tickets, private, voyeur, meter — do they show here?” Yes. They appear with the same Asset / Source / Count / Gross / Your payout columns. The Source pill distinguishes them (‘ticket’, ‘private’, ‘voyeur’, ‘meter’). The Asset is the show topic if you set one when you went live.
Related
- Reading your sales dashboard — earnings by source — the full walkthrough of the same dashboard.
- Pricing your clips — what the platform allows and how to use sales — how to set prices on the clips you’re trying to push.
- Tags and categories explained — how to use them so fans find you — the metadata that turns “good clip” into “found clip”.
- Reading your Payouts page — once you’ve identified the winners, this is where the money actually shows up.
- Offering clip discounts to your subscribers — once a clip is a winner, this is how you turn it into a subscriber acquisition tool.
- Pinning content to your store — choose what visitors see first — once you know which clips earn, this is how you put them first on your store page.