
Video guide
Prefer to watch? This short guide reads the Earnings by Source dashboard with you — the date-range pills, the eight KPI cards (gross versus your payout, paying viewers, tippers, live sessions, clip buyers, new subscribers, shipped orders), the per-source chips, the daily breakdown chart, the top-earning table, and the CSV and monthly-statement exports.
Your earnings dashboard answers one question better than any other surface on the platform: where is the money actually coming from? It breaks every cent you’ve earned out by source — tips, premium-room minutes, ticket shows, paid messages, clip sales, subscriptions, shipped products — and lets you slice it by date range, drill into individual top-earning items, and download the raw numbers as CSV. This guide walks through where to find it, what every part of the page means, and how to read it well.
1. Where to find it
- Sign in.
- Open the store-manager sidebar and click Reports (the chart-pie icon) — it lands on /store-manager/reports-sales-by-date/ (the legacy Sales-by-date report).
- At the top of that page click the Sales by product tab — that’s the one you want. Direct URL: /store-manager/reports-sales-by-product/. (The neighbouring tabs — Sales by date, Low in stock, Out of stock — are the legacy WC reports and won’t show your earnings the way this one does.)
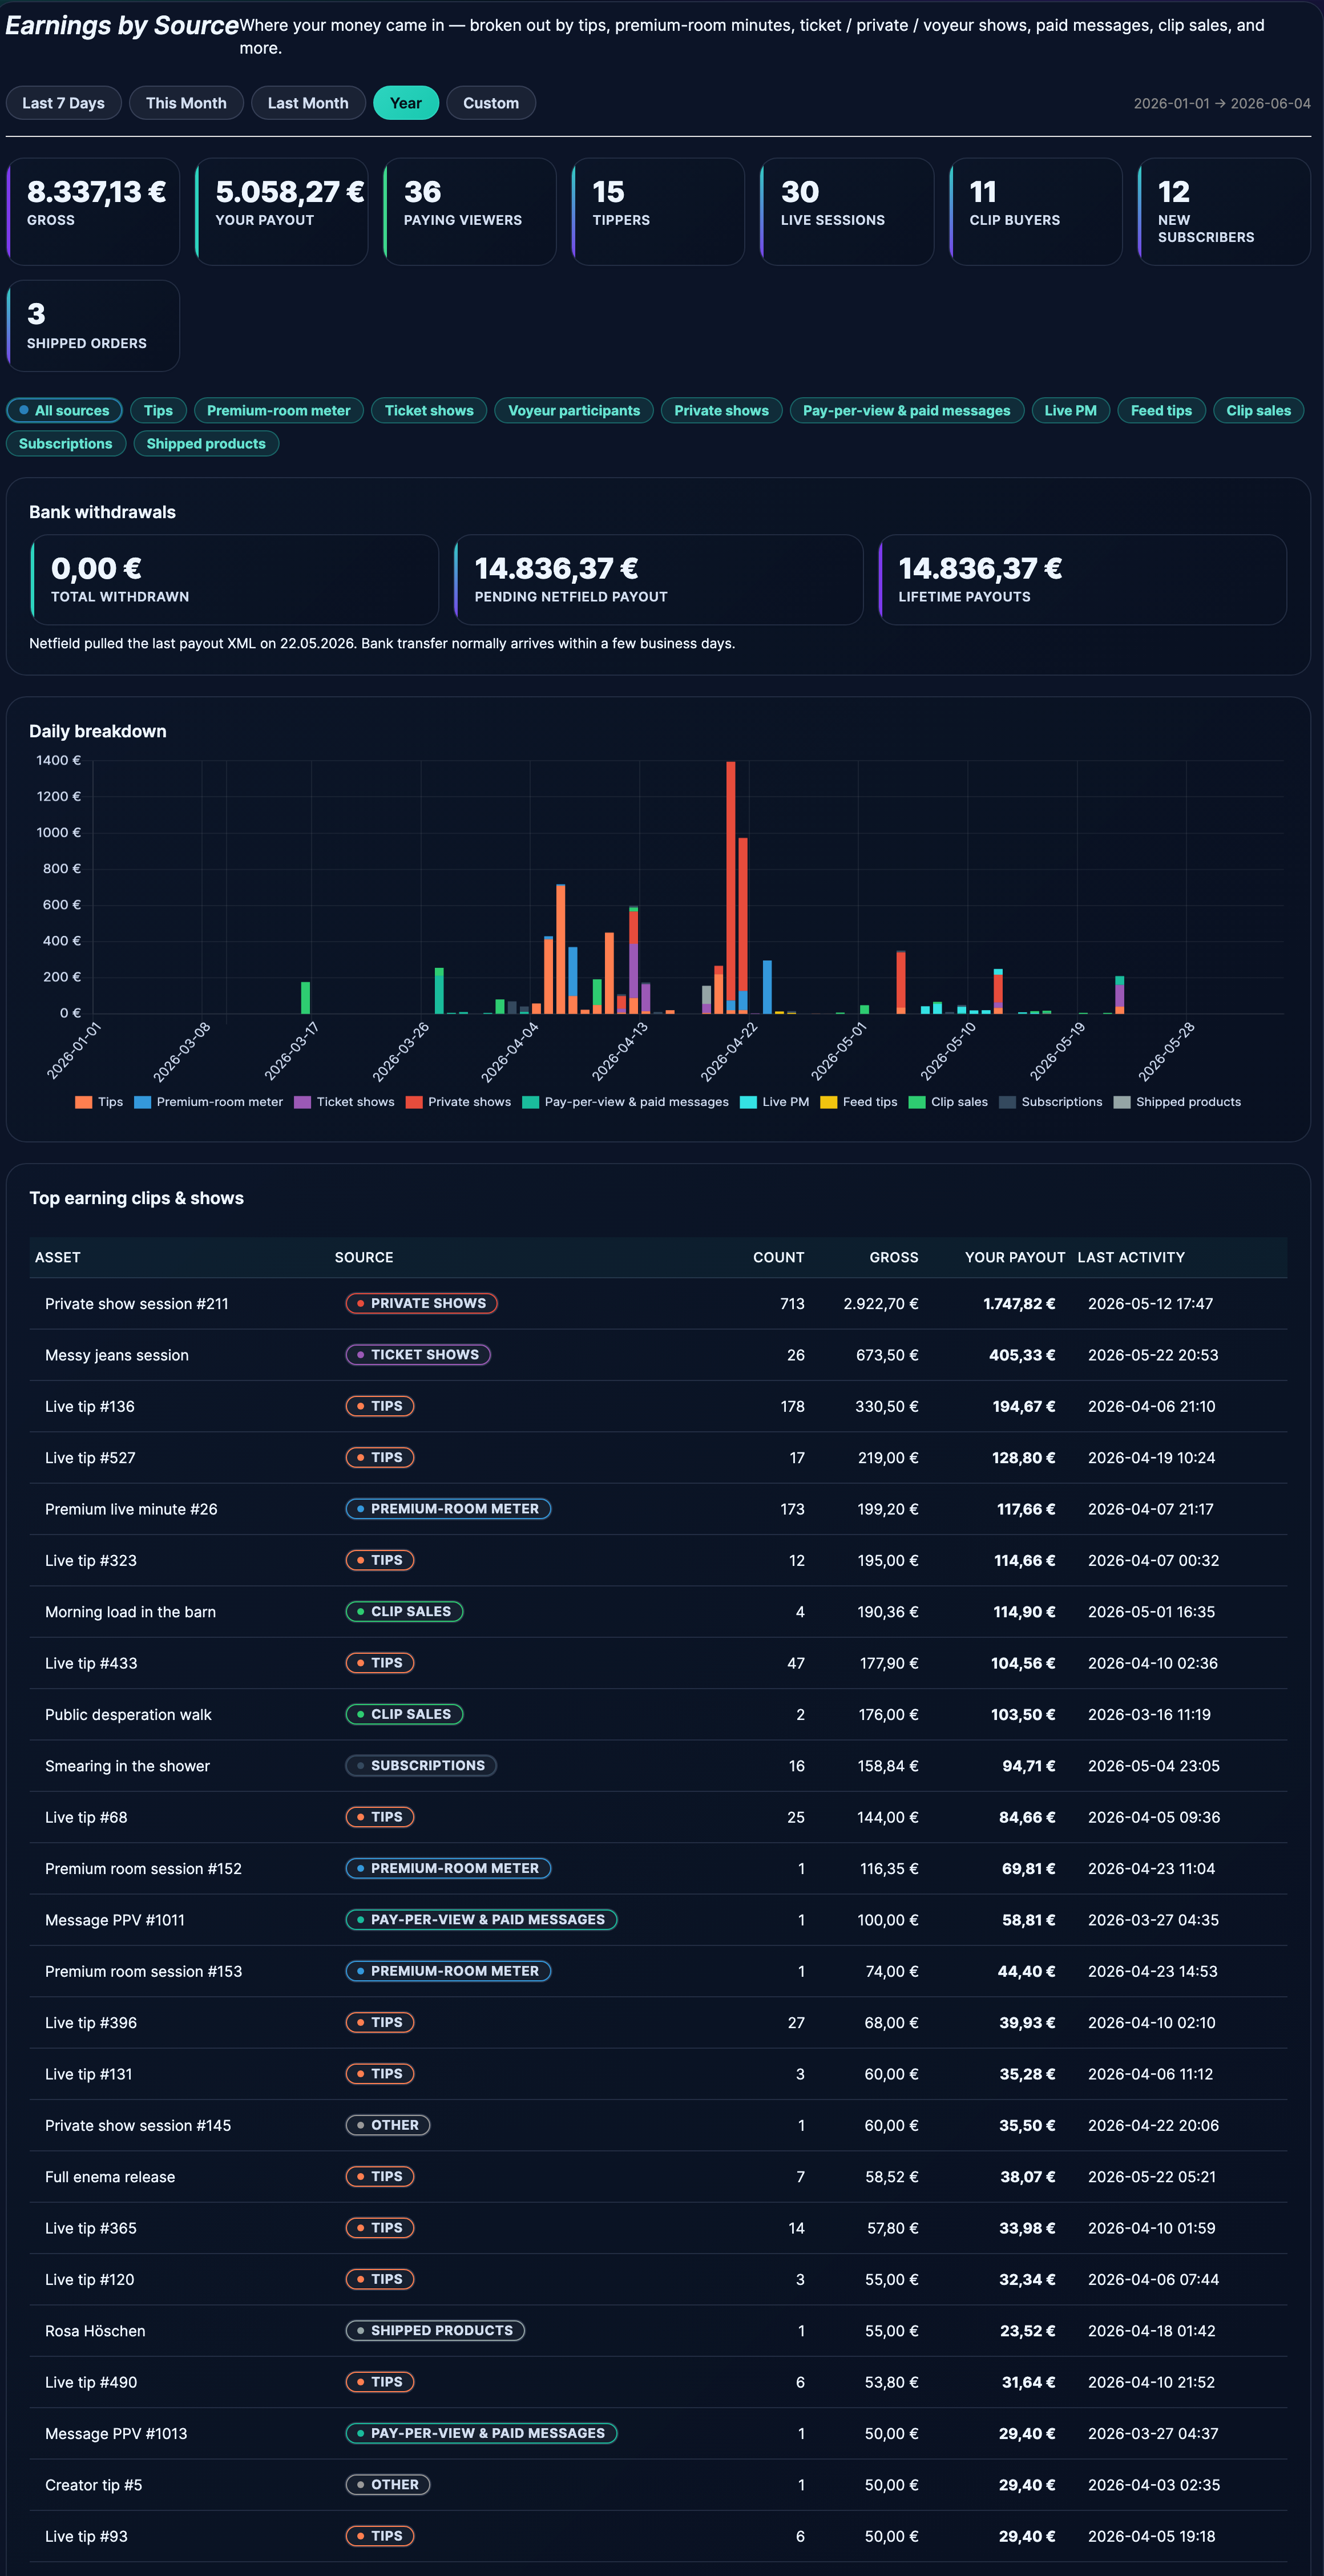
- You land on the page titled Earnings by Source with a one-line subtitle: “Where your money came in — broken out by tips, premium-room minutes, ticket / private / voyeur shows, paid messages, clip sales, and more.”
The tab label still says “Sales by product” but the page itself is the new source-broken-out earnings view. Same destination — different name on the door. Bookmark the direct URL if you visit it often.
2. The date-range bar
Right under the title, a row of date-range pills sets what the page shows. Five options:
- Last 7 Days — the default.
- This Month — month-to-date.
- Last Month — full prior calendar month.
- Year — January 1 of the current year through today.
- Custom — pick a start and end date yourself.
To the right of the pills, the resolved date range is printed (“2026-04-15 → 2026-05-10”) so you always know what window the numbers below are for.
3. The KPI cards
Under the range bar, eight cards summarise the headline numbers for the selected range:
| Card | What it shows |
|---|---|
| Gross | The total before the platform’s commission split. This is what fans paid you in total. |
| Your payout | What you actually keep after the commission split. This is the number that lines up with payouts. |
| Paying viewers | How many distinct fans paid you something in this window — across all sources combined. |
| Tippers | How many distinct fans tipped you (subset of paying viewers). |
| Live sessions | How many live broadcasts you ran. |
| Clip buyers | Distinct fans who bought one or more clips. |
| New subscribers | How many fans subscribed to you in this window. |
| Shipped orders | How many physical-item orders you marked shipped. |
The Gross / Your payout pair is where most creators look first. The gap between them is the platform’s cut — useful to verify the split is what you expect.
4. Bank withdrawals (when there’s money in your payout pipeline)
If there’s any money sitting in your payout pipeline — paid out already, or queued and pending — a separate Bank withdrawals block appears between the KPIs and the daily chart, with three numbers:
- Total withdrawn — the total your bank has actually received from us.
- Pending Netfield payout — money owed to you that’s queued but hasn’t transferred yet.
- Lifetime payouts — every euro ever paid out across the lifetime of your account.
Underneath, a one-line status: either “Last bank transfer: [date]”, or “Netfield pulled the last payout XML on [date]. Bank transfer normally arrives within a few business days.”, or “Your first payout is queued and will be transferred on the next monthly cycle.”
For the full payout schedule, what counts as pending vs paid, and how the IBAN comes into it, see How creator payouts work.
5. Source chips — slice by where the money came from
Below the KPIs is a row of chips: All sources first, then one per revenue stream. Click a chip and the rest of the page (the daily chart and the top-earning table) filters to that source only. The chips:
- Tips — free-form and tip-menu tips during live shows.
- Premium-room meter — the per-minute charges in Premium per-minute rooms.
- Ticket shows — ticket purchases for ticketed live broadcasts.
- Voyeur participants — fans paying to watch a private show as a voyeur.
- Private shows — 1:1 private show payments.
- Pay-per-view & paid messages — PPV unlocks on locked messages and PPV media in chat.
- Live PM — paid private messages sent through the live-room PM panel.
- Feed tips — tips sent on feed posts.
- Clip sales — one-off clip purchases.
- Subscriptions — recurring monthly subscription payments.
- Shipped products — physical-item orders.
The colour next to each chip carries through to the daily chart legend and the table’s source pills, so you can scan visually.
6. The daily breakdown chart
The Daily breakdown chart stacks daily earnings across the selected range. With All sources selected, every bucket gets its own colour band per day; with a single source selected, only that source’s bar shows.
If the range has no earnings yet, the chart area shows “No earnings recorded in this range yet.” instead.
This is the single most useful surface for spotting patterns — which days of the week earn most, what happens on streaming days vs non-streaming days, whether a feature you launched (a sale, a new subscription tier) actually shifted the numbers.
7. Top earning clips & shows
Below the chart, a table called Top earning clips & shows lists individual items that produced revenue in the selected range. Six columns:
| Column | Shows |
|---|---|
| Asset | The clip name, show title, subscription tier — whatever the line item is for. |
| Source | Coloured pill for the bucket (Tips / Clip sales / Subscriptions, etc.). |
| Count | How many transactions happened against this asset. |
| Gross | Total before the commission split. |
| Your payout | What you keep after the split. |
| Last activity | The most recent date and time this asset earned anything. |
If you haven’t sold or received anything in the range, you’ll see “Nothing to list yet — once viewers tip, subscribe, or join a show, it’ll show up here.”
8. Per-clip earnings card on the edit page
The dashboard shows you the top earning items, but every individual clip carries its own miniature earnings card on its edit page. Open any clip from Products in the store-manager sidebar, and the Earnings for this product (last 90 days) card shows four numbers:
- Sales — how many times the clip sold.
- Total — gross revenue in EUR.
- Your payout — what you kept after the split.
- Distinct buyers — how many unique fans bought it.
Plus a footer line: “Last sale: [date]”. Empty state: “No sales yet — once someone buys this, the totals will show up here.”
9. CSV export & monthly statement
At the bottom of the page, two buttons:
- Download CSV — exports the current view (selected range and source) as a comma-separated file. Use it for tax prep, import into a spreadsheet, or to feed into an accountant’s template.
- Monthly statement (printable) — opens a printable statement for the month containing your range’s end date. This is the single page to print or save when you need a clean record for the books.
Right next to the buttons, a small disclaimer: “Refunded transactions are excluded.” followed by either an “Updated [date]” timestamp or “Numbers refresh once per day.” The dashboard reads from a daily rollup, so today’s numbers may lag a few hours behind real-time.
10. Reading the dashboard well — patterns to look for
- Source mix. The split between Tips / Subscriptions / Clip sales tells you what your business actually is. A creator who’s 80% tips runs differently from one who’s 80% subscriptions. There’s no “right” mix — but knowing yours helps decide where to put the next hour of work.
- Tippers vs paying viewers. If they’re nearly equal, most of your paying fans tip. If Tippers is much smaller, your other revenue (subs, clips, shows) is doing the heavy lifting.
- Live sessions vs live revenue. Cross-check Live sessions in the KPIs with how much the Live-related buckets (Tips, Premium-room meter, Ticket shows, Private shows) added in the same range. Low ratio = streams aren’t converting; might mean the room mode isn’t right for your audience.
- Last activity column. A clip with high lifetime sales but a “Last activity” weeks ago is a candidate for a relaunch — boost it via a feed post, mention it in a stream, drop the price for a week.
- Year vs Last 7 Days. Toggle between them to see whether you’re growing — if Year-to-date averages out to less per week than Last 7 Days, your trend is up.
11. Common questions
Q: Why does Gross differ from what fans paid me on a single transaction?
Gross on the dashboard already excludes refunded transactions. If a fan paid €10 and was refunded, the dashboard shows €0 for that transaction. The disclaimer at the bottom confirms this.
Q: Why is the dashboard showing yesterday’s numbers as 0?
The dashboard reads from a daily rollup that runs once per day. Today’s earnings appear within a couple of hours of each transaction, but the rollup may not have processed yesterday’s entries yet. Check back later or look at the “Updated [date]” timestamp at the bottom.
Q: My total here doesn’t match my last payout.
That’s expected. The dashboard shows earnings in your selected date range; payouts are a separate cycle that bundles up earnings since the last one. See Reading your Payouts page for the cycle view.
Q: Where do tips from the live room show up?
Under the Tips bucket. Both free-form tips and tip-menu triggers count toward the same bucket — there’s no separate slice for menu vs free-form.
Q: A clip is in the Top earners list but I don’t recognise it.
Click through to the clip via your Products page — internal helper products and discount-line items can occasionally appear under a system-generated label. The Asset column will show whatever name the clip was published with.
Q: Is the CSV export the same as the monthly statement?
No. CSV is the raw dataset for the current view (range + source). The monthly statement is a clean printable summary for one calendar month — better for printing or filing.
Related guides
- Top performing clips — a deeper dive on the Top earning clips & shows table: how to use the source filter, how the chart is windowed, and what to do with a clip that out-earns the others.
- How creator payouts work — the cycle behind the Bank withdrawals block.
- Reading your Payouts page — earnings, pending, paid as separate views.
- Changing your IBAN or bank account — what to do if your withdrawals aren’t landing where you expect.
- Setting up your tip menu — feeds the Tips bucket.
- Setting up your subscription — feeds the Subscriptions bucket.